How To See Cpu Interworx – Step-By-Step Instructions!
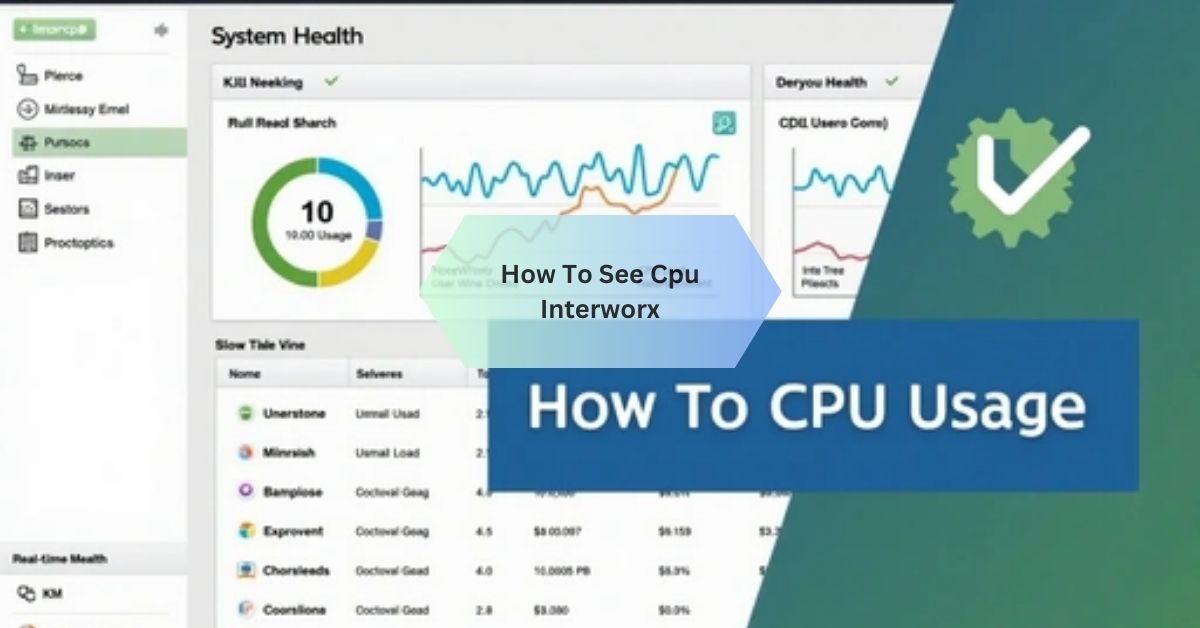
When I needed to check the CPU usage in InterWorx, I logged into the NodeWorx dashboard and navigated to the “System Health” section. It was straightforward, and I could see real-time stats for CPU load, which helped me troubleshoot performance issues.
How To See Cpu Interworx, log into NodeWorx, go to the “System Health” section, and view real-time CPU stats. This helps monitor and troubleshoot server performance efficiently.
Stay tuned with us as we dive into the details of how to see CPU InterWorx. We’ll guide you through the steps to monitor your server’s CPU usage efficiently!
Step-by-Step Guide: How to See CPU Usage in InterWorx!
This guide outlines the step-by-step process for checking CPU usage in InterWorx, explains the benefits of monitoring CPU performance, provides a competitor analysis, and offers tips for optimizing your server’s performance.
Logging into NodeWorx
Here’s how to log in:
- Open your preferred web browser and navigate to your NodeWorx login page (e.g., https://<your-server-ip>:2443).
- Enter your admin username and password.
- Click Log In to access the NodeWorx dashboard.
Navigating to the “System Health” Section
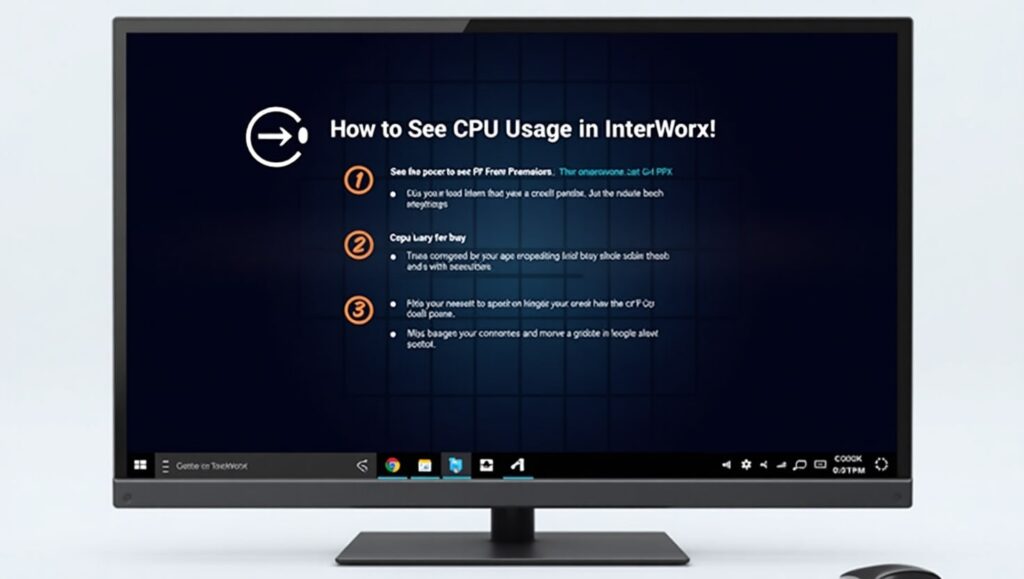
- From the NodeWorx dashboard, locate the System Health section in the menu.
- Click on Load Monitoring or CPU Usage, depending on your version of InterWorx.
- The CPU usage stats are displayed in a graph or tabular format, offering real-time data and historical trends.
This section provides detailed insights into your server’s CPU load, including key metrics like:
- CPU Load Averages: Short-term, medium-term, and long-term averages of CPU load.
- Processor Utilization: Percentage of CPU being used by processes.
- Individual Process Usage: Detailed breakdown of which processes or applications consume the most CPU resources.
Also Read: Pcie Card Stopped Working After Cpu Upgrade!
Interpreting the CPU Load Stats and Understanding Key Metrics!
Understanding CPU usage metrics is vital for assessing server performance. Here’s a breakdown of key metrics you’ll encounter:
- Load Average: This shows the number of processes waiting to run. Ideally, the load average should be below the number of CPUs or cores available on your server.
- Idle Time: Represents the percentage of CPU capacity currently not in use. A lower idle time indicates higher server utilization.
- Process Breakdown: Identifies applications consuming the most resources, helping pinpoint potential bottlenecks.
By interpreting these metrics, you can proactively address issues like server overload or underperforming applications.
Benefits of Monitoring CPU in InterWorx!
Monitoring CPU usage in InterWorx offers numerous advantages:
Real-Time Insights Into Server Performance
InterWorx’s CPU monitoring tools provide live data, allowing administrators to detect performance spikes or irregularities instantly.
Identifying Potential Bottlenecks
By analyzing CPU stats, you can identify resource-intensive processes or misconfigured applications that may slow down your server.
Improved Server Reliability
Consistently monitoring CPU usage ensures you can address potential issues before they escalate, reducing downtime and improving user experience.
Also Read: Cpu Stress Test 80 Degrees – What You Should Know!
Competitor Analysis!
While InterWorx is a robust server management tool, it’s essential to evaluate how it compares to its main competitors: cPanel, Plesk, and DirectAdmin.
Cpanel
- Features: Known for its user-friendly interface and comprehensive features, including application installers and email management.
- CPU Monitoring: cPanel offers monitoring tools, but they are not as visually intuitive as InterWorx.
- Pros: Extensive ecosystem of plugins and widespread adoption.
- Cons: Higher licensing costs compared to InterWorx.
Plesk
- Features: Supports a wide range of platforms and integrates with cloud solutions.
- CPU Monitoring: Plesk’s monitoring tools are powerful but can be complex for new users.
- Pros: Versatile, with robust security options.
- Cons: The interface can feel cluttered, and some features require additional extensions.
Directadmin
- Features: Lightweight and straightforward, suitable for smaller setups.
- CPU Monitoring: Provides basic CPU stats but lacks the real-time visual graphs offered by InterWorx.
- Pros: Cost-effective and easy to use.
- Cons: Limited features compared to InterWorx or cPanel.
Unique Features Of Interworx
- Intuitive interface with real-time, visually appealing CPU graphs.
- Built-in clustering capabilities for advanced server management.
- Lower licensing costs, making it ideal for smaller businesses.
Summary Of Pros And Cons
| Feature | InterWorx | cPanel | Plesk | DirectAdmin |
| Ease of Use | Intuitive and streamlined | User-friendly | Complex for beginners | Very simple |
| CPU Monitoring | Real-time stats, visual graphs | Basic tools | Advanced, but cluttered | Limited stats |
| Cost | Affordable | Expensive | Moderate | Very affordable |
Tips for Optimizing Server Performance!
Regularly Monitor Cpu Usage
Regularly check the CPU stats in InterWorx to identify trends and address resource-intensive applications.
Upgrade Hardware Or Allocate More Resources
If your server consistently operates at high CPU loads, consider upgrading your hardware or reallocating resources to ensure smoother performance.

Utilize Built-In Interworx Tools
InterWorx offers several built-in tools to optimize server performance, including:
- Clustering Features: Distribute workloads across multiple servers for better resource management.
- Resource Alerts: Configure alerts for CPU thresholds to prevent overload.
Optimize Applications
- Remove unused applications or scripts.
- Optimize database queries and scripts for better efficiency.
Leverage Caching
Implement server-side caching tools to reduce the load on your CPU, especially for high-traffic websites or applications.
Also Read: Native Renderer Cpu Message – Simplified For Beginners!
FAQS:
How do I check CPU status?
You can check CPU status by logging into your server’s control panel (like InterWorx) or using monitoring tools. These provide real-time data on CPU performance and load.
What is the command to see CPU usage?
Use the command top or htop in your terminal to view CPU usage in real time. It shows active processes and how much CPU each is using.
What Is Cpu Monitoring?
CPU monitoring is checking how much of your processor’s power is being used. It helps ensure your system runs smoothly without overload.
Why Is It Important To Monitor Cpu Usage?
Monitoring CPU usage helps find performance issues and prevents slowdowns. It keeps your system running efficiently.
Can I Monitor Cpu Usage Without Logging Into A Server?
Yes, you can use software or external tools to monitor CPU usage remotely. These tools give real-time updates on system performance.
How Often Should I Check Cpu Usage?
Check CPU usage regularly, especially during heavy workloads. Frequent monitoring helps catch problems early.
Conclusion
understanding how to see CPU InterWorx is crucial for maintaining optimal server performance. Regularly monitoring CPU usage through the NodeWorx interface helps prevent potential issues and ensures your system runs efficiently.
